
Intro
One of the biggest concerns that people have, with the migration from Universal Analytics (UA) to Google Analytics 4 (GA4) is that some of the essential metrics, which they used to rely on, are now defined differently. Therefore discrepancies between the new and old metrics will make comparisons to previous periods problematic.
That is the main reason why every agency or analytics expert out there has been recommending implementing GA4 early on, so you can have at least one year of data collected in GA4 by the time UA will be sunsetted (July 2023 for Free version, July 2024 for 360). Having one year of data in GA4 will facilitate good comparisons to UA data & establish new baselines which will make previous period comparisons so much more trustworthy.
Even so, some businesses are concerned about the discrepancies and the impact this will have on trust in their data. As such, in this article, we will aim to clarify why these differences exist, how big they are, and what we can do about them.
Comparing metrics across UA and GA4
Within this article, we will address standard and custom metrics/conversions separately. That’s because with standard metrics all the differences are due to the fact that these metrics are defined differently by Google across the platforms. Custom metrics/conversions on the other hand, although they are triggered/defined by you, there are still some nuances to be considered when running comparisons.
Before we get into the details, I’d like to emphasise that the point of the comparison exercise shouldn’t be to find a way to hack GA4 to show the same numbers as UA so that your trendlines aren’t disturbed. It is not sustainable to always be applying custom configurations to extract numbers from GA4 that will perfectly fit into your existing reporting. Differences between UA and GA4 will exist and the goals should be to
- understand where they are coming from (aka are these differences due to tracking issues or are these differences due to the fact that metrics are now defined differently)
- understand the percentage differences between GA4 and UA and establish your new baselines, across all of your important KPIs.
1. Standard Metrics
For the purposes of this article, we’ll focus on the 2 most important metrics that marketers and analysts keep trying to compare: Users and Sessions.
Users comparison
Given that, as we’ve mentioned above, the standard users metric is defined differently in GA4 vs UA, can we still compare this metric between the two?
We’ll start by saying that for businesses who only own a website, the comparison is going to be straightforward and discrepancies will be low and tolerable. For businesses that also own an app, the comparison will be a bit more challenging (As all things are with apps. No surprise there, right?)
We’ll jump straight into the how and get into the why later. For most websites and apps, one way to get similar numbers (provided that the discrepancies in numbers are not due to tracking issues) is the following:
| Platform | UA | GA4 | UA | GA4 |
|---|---|---|---|---|
| Data Source | Web | App | ||
| Metrics to use | Users | Total Users | Users | Total Users |
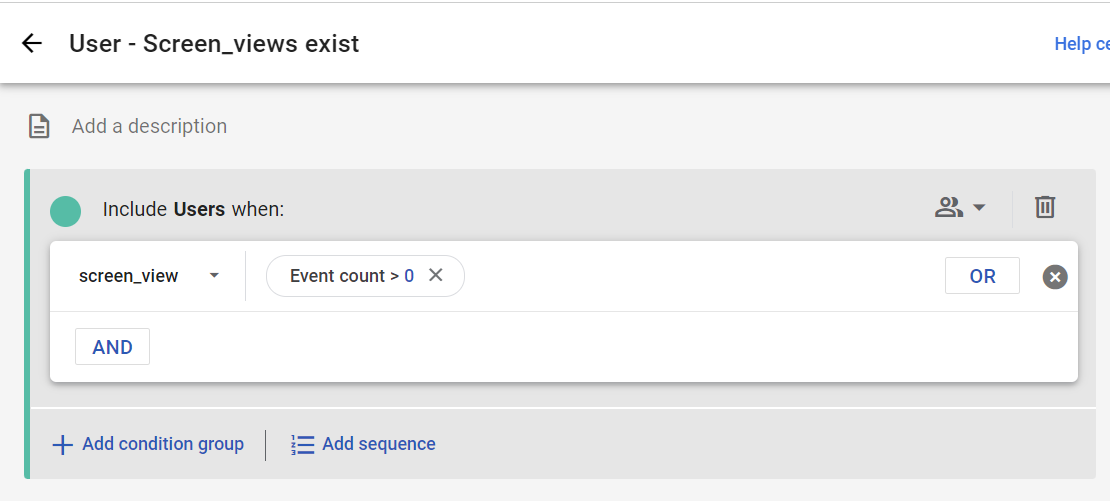
| Additional Settings | Type of View: Regular View (not User ID enabled) | Reporting Identity: Device-based | Type of View: Regular View (not User Id enabled) | Reporting Identity: Device-based Configuration: Segment applied to only include users if they had at least one screen_view event |
Do not forget to account for any filters you might have on the UA view you are using, which couldn’t be replicated in the GA4 property!
Doing the comparison like this has resulted in discrepancies below 3% (both for app and web). These results are based on comparing data across 6 businesses.
It’s important to note that a perfect match is not expected since users are counted differently across the two platforms, however, I’ll reiterate that the goal here is not to 100% replicate your UA set-up, but rather to confirm the validity of the data collected in GA4. As such, discrepancies below 2-3% should be tolerable.
Now, for those who also want to get into the why, we’ll cover below the reasons why the comparison has to be done this way. It all goes back to how Google defines a user and when is a user actually recorded within the Analytics System.
Universal Analytics
What is the user definition based on?
In Universal Analytics, in most views, a user would be identified based on a unique device and browser combination (client ID), or in the case of apps based on the app instance ID.
Some views could be user ID enabled, in which case a user would be defined based on a user ID (normally generated on the website/app when the user would create an account). These views would only ever include hits (events, pageviews) where the user ID was associated with the request, which generally meant that users who would come to the site but never create an account would not be counted in these views.
As such, for any type of website where users don’t necessarily have to immediately log in or create an account to browse the site, user ID enabled views would always be undercounting the number of users on the site, while the non-user ID enabled ones would always be overcounting since the same person could visit the website from their desktop and from their mobile meaning that they’d be counted as 2 users, based on their device ID (a widely known and accepted caveat in UA). Therefore, when comparing across tools, for all your users, it’s most likely that a regular view would be chosen.
When is a user actually recorded in reporting?
A user will be recorded and shown in UA, for your particular timeframe, if either of the following happened:
- At least one pageview/screen view has fired
- At least one manually tracked event has fired (interaction or non-interaction event).
Google Analytics 4
What is the user definition based on?
In GA4 user count is done differently. The way the users are counted is defined at the property/subproperty level through a setting called Reporting Identity.
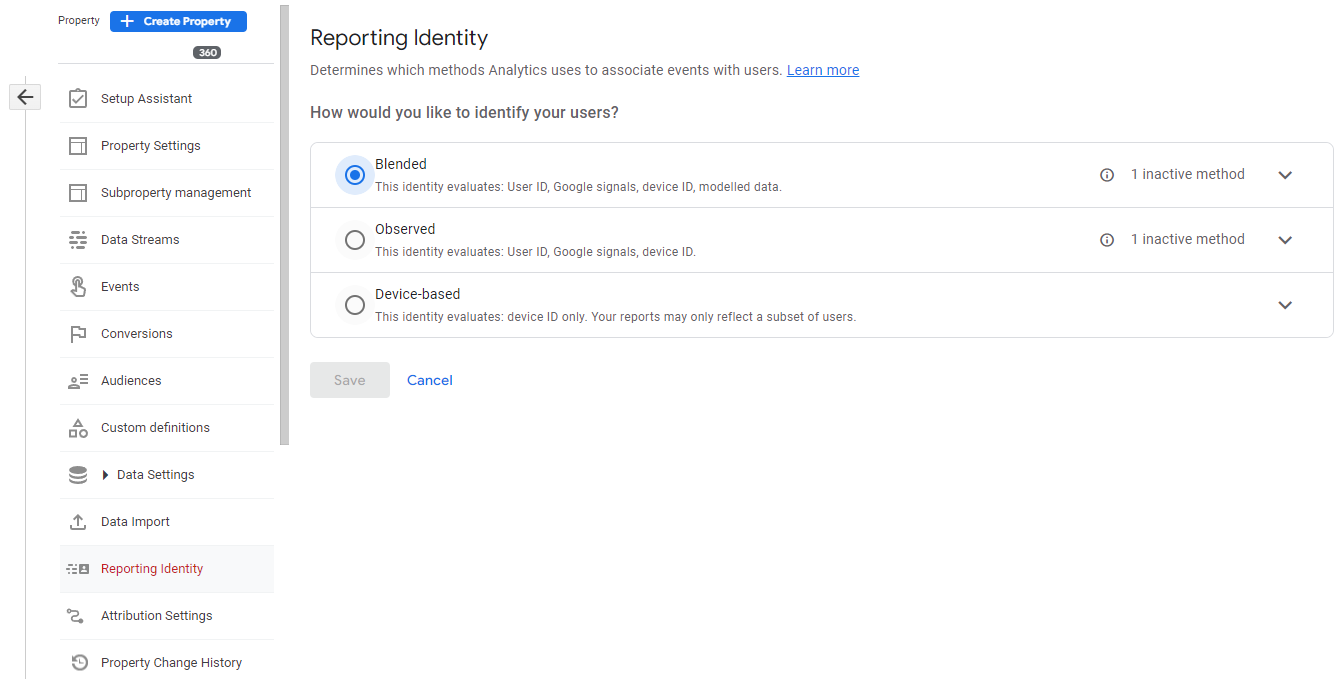
We won’t get into the details of what each reporting identity is and how a user is defined in each case, as that would be in itself a very long article. However, for the purposes of the topic at hand, it’s important to understand that the Device-based reporting identity (relying on client ID or app instance ID) is the closest way of counting users in Universal Analytics (in a non user ID enabled view).
That does not mean that the Device-based reporting identity is the one you should always use, it simply means it’s the one that would result in the least discrepancies between GA4 and UA user numbers, given that users would be counted in a similar way.
Side Note: In GA4 you can simply switch back and forth at any time between these reporting identities, without it having any permanent impact on your data processing.
When is a user actually recorded in reporting?
A user will be recorded and shown in GA4, for your particular timeframe, if any of the following happened:
- At least one pageview/screen view has fired
- At least one manually tracked event has fired (there is no concept of interaction or non-interaction event in GA4).
- At least one automatically collected event, like first_open or user_engagement, has been fired.
This last point is what makes the difference, especially for apps.
Imagine this navigational pattern: you used the app yesterday, then put it in the background, and then the next day you brought it back from the background, to quickly check something on your dashboard, but don’t navigate to other screens or tap on any tracked buttons. If the app is not configured to send a new screen_view when it’s brought back from the background and you didn’t generate any of the manually tracked events, then the app sends a user_engagement event but no screen_view or other manually tracked event. As such, you will be counted in GA4 for that day, due to the user_engagement event, but won’t be counted in UA, since user_engagement events are not tracked in UA.
This is the reason why, for apps most importantly, this additional configuration with the segment including a user only if they had at least one screen_view event, is required in order to ensure you replicate the way users are counted in Universal Analytics.
Sessions Comparison
With sessions, things become a bit trickier, as the way sessions are defined is quite different between GA4 and UA.
For comparing sessions we won’t share a solution simply because for some websites you just won’t need it, numbers will effortlessly match, sometimes with discrepancies as low as 1%, while for other websites, there’s no generally valid and easy-to-replicate solution that will get you to 1-2% discrepancy.
Many experts recommended that you abandon all hope of comparing this metric across properties and focus instead on Users and Events since that’s what GA4 is best at. That’s not bad advice! However, before you take it, I’d hope you’d want to understand why.
With this metric as well, it all goes back to how Google defines a session and when is a session actually recorded within the Analytics System. To begin with, the basic definition of a session remains the same across both tools. A session is a group of user interactions with your website that take place within a given time frame. What changes, however, is when a session starts and when it ends.
Universal Analytics
When does a session start and gets recorded in reporting?
A session will be recorded and shown in UA, for your particular timeframe, if either of the following happened:
- At least one pageview/screen view has fired
- At least one manually tracked event, which wasn’t marked as non-interaction, has fired.
Note: Within apps, hits (events, pageviews) aren’t always sent instantly as they are on web. These are sometimes batched together and stored, then sent at a later time (generally done to save battery life or if the internet connection is lost). In UA hits are only processed if they arrive within 4 hours of the close of the preceding day (this means that events sent after that timeframe, and sometimes consequently entire sessions, won’t be recorded)
When does a session end?
A session ends in any of the following cases:
- 30 minutes of inactivity have gone by since the last tracked interaction.
- During an active session, if a new source/medium is detected then the existing session is terminated and a new one is started.
- During an active session, at midnight, the existing session is terminated and a new one is started.
Google Analytics 4
When does a session start and gets recorded in reporting?
A session will be recorded and shown in GA4, for your particular timeframe, if any of the following happened:
- At least one pageview/screen view has fired
- At least one manually tracked event has fired (there is no concept of interaction or non-interaction event in GA4)
- At least one automatically collected event, like scroll or user_engagement, has been fired.
Note: In GA4, batched events from apps are processed and recorded if they arrive up to 72 hours late. Because Google Analytics 4 events are processed/recorded across a wider time range, you may see higher session counts in your Google Analytics 4 property.
When does a session end?
A session ends in any of the following cases:
- 30 minutes of inactivity have gone by since the last tracked interaction.
As you can see there are notable differences, both in when a session starts as well as when it ends. Although, generally, the difference of when a session starts will play the greatest role in the discrepancy. The navigational patterns we’ve exemplified above when talking about users also justify the session discrepancy.
It’s also important to understand that the differences in how the metric is defined, don’t manifest the same across all platforms. Whether your session number will align between properties also depends on if you are looking at an app or a website and if a website, what type of website.
For example, you will see the most striking differences across apps and often negligible differences on standard (non-SPA) ecommerce websites.
To give you an understanding of the kind of impact that the last bolded bullet point (“At least one automatically collected event, like scroll or user_engagement, has been fired.”) can have in apps, we’ve seen apps where the discrepancy between UA Sessions and GA4 Sessions was over 50% and when the segment was applied to GA4 data to only include sessions which had at least one screen_view, the discrepancy went down to 0.5%. That’s not to say this will be the case for all apps, it’s highly dependent on the type of app, the functionality of the app and how it’s used by your customer base.
As an example, the differences we’ve seen range between 1 – 2.5% (on standard non-SPA ecommerce websites) and in the majority of cases over 50% for apps.
2. Custom Conversions/Events/Metrics
We’ll be addressing these separately since they are independent of Google’s own definitions for metrics. These rely either on the events that you have in your datalayer or on some events based on data attributes or site scraping. These shouldn’t normally change, given that your GA4 event tracking can fire based on the exact same triggers that your UA is currently firing on. Therefore, major discrepancies between your conversion numbers should not exist, except… yes, of course there would be exceptions.
Some of these exceptions are due to the different behaviours of platforms (app vs web), while others are due to the type of conversion you were using. Let’s start with the:
Different types of conversions:
| UA Goals | UA Custom Metrics | GA4 Conversions | GA4 Custom Metrics | |
|---|---|---|---|---|
| Based on: | Events | Events | Events | Events |
| Incremented when | Once per Session* | Each time the event fires | Each time the event fires | Each time the event fires |
| Can be used in Standard Reports | Yes | No | Yes | Yes |
| Can be used in Custom Reports/ Explorations | Yes | Yes | No** | Yes |
| Requires additional configuration in the tracking (apart from the event itself) | No | Yes | No | Yes |
| Has to be configured within the tool’s interface | Yes | Yes | Yes | Yes |
* Imagine you own a travel website, where you sell many trips in various locations around the world. Potential customers could fill in a form to request a quote for a trip and that would fire an event. That would increment the UA and GA4 custom metrics for quote requests by 1, the GA4 Conversion by 1 and the UA event-based Goal by 1. If within the same session the user filled in a second form, for a different trip, both custom metrics and the GA4 Conversion would be incremented again, while the UA Goal would not, since the goal only counts once per session.
** At the time of writing this article, in Explorations there is only a Conversions metric, which counts ALL Conversions. Individual Conversions can’t be applied as standalone metrics in Explorations. Hopefully, this is expected to change soon.
Given the above, be careful not to fall in the trap of comparing goals against conversions. Your best bet would be to stick to comparing Total Events in UA vs Event Count in GA4. Although depending on the platform, even this has its own caveats, which brings us to our second point:
Discrepancies on app
When discussing sessions in the previous section, we’ve already mentioned that in apps hits can get batched together and sent later than when they actually occur and that app events can be completely lost if sent too late. The volume of the loss would be different between UA and GA4, due to the different processing times (batched events are processed up to 72 hours late on GA4, while in UA late batched hits are only processed within 4 hours of the close of the preceding day).
This impacted both iOS and Android in cases when the user didn’t have internet for a prolonged period of time and would then regain access to the internet and the batched hits would come through. Depending on when they reconnected to the internet, the hits could be processed on GA4 but not on UA. This will explain why for apps not even Total Event in UA can align with Event Count in GA4.
Additionally, the discrepancies on iOS are likely to be even higher, due to the fact that in Universal Analytics, for iOS apps, unlike for Android apps, events which have been batched together, don’t automatically get sent through to Analytics when the app is sent to the background. GA4 events are uploaded automatically when iOS apps are backgrounded.
That in turn means that even if the users had a perfect and consistent internet connection, if they closed the app before a batch of hits was sent through (which would generally happen quite often as hits are almost always batched on apps and not sent instantly) and only reopens it the next day, then their hits would be lost from UA but processed in GA4.
Conclusion
While comparing identically named metrics across tools from the same provider might sound like an easy job, this article has clearly pointed out the many hurdles in the way of a clean comparison. However, the most important takeaway should be that while certain comparisons are possible through workarounds, the end goals shouldn’t be to get two completely different tools to align, the goal should be to understand the new normal and establish a new baseline for your trendlines.