
Summary
DMPG have been implementing Adobe Analytics since 2010 and in all cases have always looked to use the full capabilities of the analytics tools clients operate. Merchandising tracking within Adobe Analytics is one of the most powerful features of the tool when used in conjunction with the standard DMPG Data Layer Framework or an equivalent W3C specification Data Layer.
This article is designed to be an overview of what we believe the best practice methods are for tracking product merchandising modules and interaction with those modules across any digital platform whether it be websites, a mobile app or perhaps even a fridge. The documents could be taken by a client directly and implemented without further support but it is highly recommended that any business planning to utilise these solution design documents works directly with DMPG to ensure it gets implemented, tested and evaluated correctly.
Definitions
A module is defined as a component of a screen that is not directly tied to that specific screen. That is to say that the same module may be expected to be seen across a wide array of screens rather than being tied only to an individual screen or screen type. For example, a news app might use a ‘breaking news’ module to provide a link to a breaking news article. This module will likely appear on article screen, content category screens, article list screens, search results screens and more. The module is therefore screen and screen type independent.
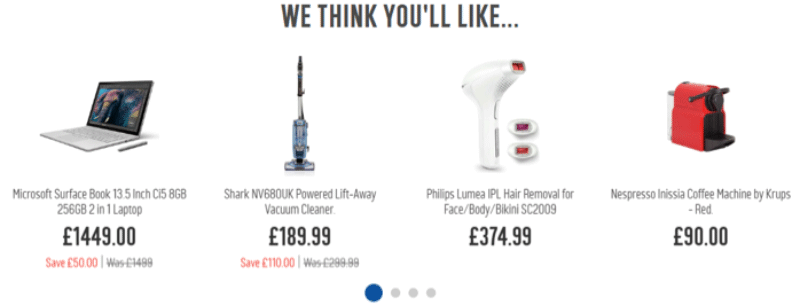
A merchandising module will typically contain a list of assets. We use the term assets as each business defines ‘product’ in a different way. For a media and broadcast business their ‘product’ may be video content whereas a traditional retailer would have physical goods as their products. In many cases a business could have a mix of item such as physical and virtual goods (DVDs plus Video Streams for example). An example of a merchandising module could be something like this:
Data Analysis Requirements
Requirements for tracking merchandising modules and the associated assets within them have come in various different formats over the years but we could generally refine them down to the following:
- To understand when a merchandising module is seen by the customer
- To understand what module items within a merchandising module is seen by the customer
- To understand when a merchandising module item is clicked by the customer
- To understand what the conversion rate is for a module item that is clicked on
- To understand what the conversion lift is for an asset when the module item is clicked
- To understand the conversion rate difference for a module item depending on what module it was in
- To understand the conversion rate difference for a module item depending on what location within the module it was in
- To understand the conversion rate difference for a module item depending on what type of screen it was located on
- To understand the conversion rate difference for a module item depending on where on the screen it was located
Within each one of these scenarios there could also be a further requirement to look at differing attribution models for how performance is allocated. Adobe Analytics will allow 3 models by default:
- Most Recent – in this case the most recently set value set at the same time the product data is set will get allocated all subsequent behaviour up the the defined expiration point, normally a purchase. This is the most logical one to pick as it to some extent guarantees that the item that was clicked should always be awarded with the subsequent behaviour.
- Linear – this allocates the resulting behaviour equally to all contributing values. As such if the user interacted with 3 different merchandising modules before a sale then each would get a third of the resulting performance data allocated to it.
- Original – this ensures that whatever the first item set against the product within the session was that this persists up to the point of expiration.
Data Layer Requirements
In order to track these requirements within Adobe Analytics the following data needs to be represented in the data layer. Note that we have provided examples using the DMPG Data Layer Framework that will seem similar to W3C although once you get into the detail you then start to see why it is so much more scalable:
| Objects | Object Properties | Type | Description | Example Values |
|---|---|---|---|---|
| modules | ||||
| id | string | Unique identifier for the module | 1234 | |
| type | string | Descriptive name illustrating what is being shown or promoted | merchandising | |
| placement | string | Describes where the module is located on the screen | hero-2 | |
| name | string | A descriptive name for the module related to what the customer will see | you might also like | |
| items | array | An array of items, normally assets within the module | ||
| moduleItem | ||||
| id | string | Unique identifier for the moduleItem – normally the same as the asset ID (e.g. SKU) | 5678 | |
| type | string | Describes what type of asset or other item it is | link | |
| position | string | Describes what position the item is within the module | 2 | |
| attributes | object | Individual attributes about the moduleItem required in the meta data to describe the item further such as ‘size’ or perhaps ‘destination’ | destination=/products/sku-abc | |
| assets | ||||
| products | array | An array of products along with associated meta data required to describe each product such as name, category, type etc |
Adobe Configuration Requirements
To ensure that all of the 8 points illustrated in the Data Analysis Requirements could be met we would need to setup the following:
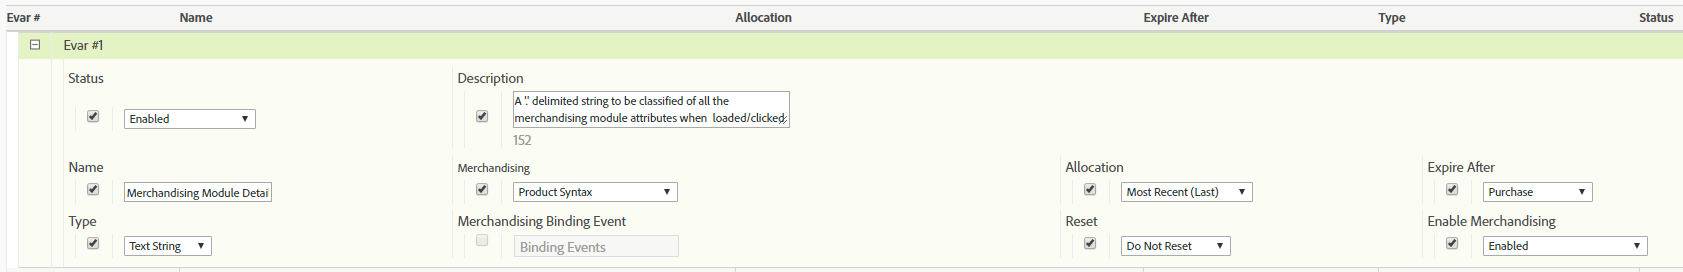
- At least 1 eVars with the following configuration:
- Name = Merchandising Module Details
- Type = String
- Merchandising Method = Product Syntax
- Allocation = Most Recent*
- Expiration = Purchase
- At least 2 events with the following configuration
- First event to track the view
- Name = Merchandising List View
- Type = Counter
- Second (OPTIONAL) event to track List Item View for line-item conversion reporting without data extraction
- Name = Merchandising Item List View
- Type = Numeric
- Second/Third event to track the Click
- Name = Merchandising Item Click
- Type = Counter
- First event to track the view
eVar Configuration View:
Event Configuration View:

Depending on the specific attribution requirements the actual number of eVars may differ. This tends to be based on two main factors:
- If the ability to allocate beyond just most recent is needed for relationships between merchandising modules
- If there is a chance that on a resulting product details page the same product is shown to the user in another merchandising module
In the first scenario there are two main options within Adobe Analytics. Firstly a second duplicate eVar set with a linear allocation could be used. This would allow analysis that compares most recent with linear to understand which modules were most likely contributors vs closers of a purchase conversion. The second option is to use sequential segmentation which will allow us to understand specific relationships between merchandising modules as we could define explicit behavioural sequences but this is a much more time consuming process.
For the second scenario it may be necessary to create duplicate eVars, one that works for the purpose of reporting on List View actions and the other for Item Click. The reason for this is that if the same product as displayed on a product details page and then again through a merchandising module on that page (unlikely I know) then this merchandising module will overwrite the merchandising module value set against that product (assuming most recent allocation has been selected) and therefore take responsibility if a sale resulted from it. Note that if you are using Adobe Target Recommendations to serve products in merchandising modules it is extremely easy to prevent the same product being seen this way.
Example Reports
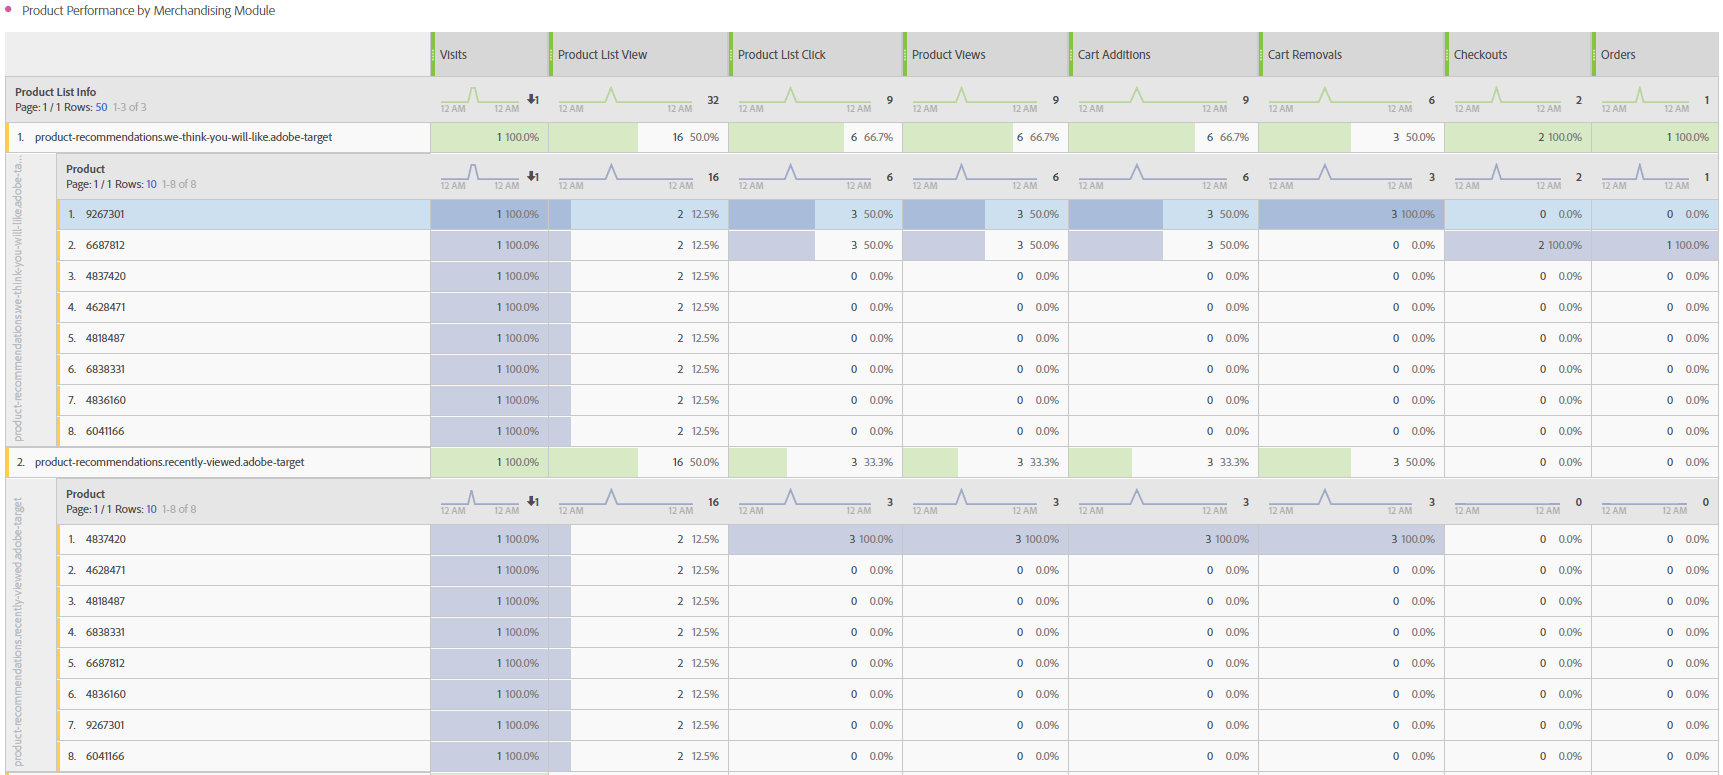
The above report illustrates an end-to-end view of product performance broken down by the specific module that was viewed and then subsequently clicked on. The main components of the data being transmitted to Adobe would perhaps a look a bit like this:
Merchandising List View
| s.events | event6,event22 |
|---|---|
| s.products | category;sku;0;0;event22=1;eVar1=we-think-youll-like.hero-2.microsoft-surface.link.1,category-2;sku-2;0;0;event22=1;eVar1=we-think-youll-like.hero-2.shark-vacuum.link.2,category-3;sku-3;0;0;event22=1;eVar1=we-think-youll-like.hero-2.philips-hair-remover.link.3,category-4;sku-4;0;0;event22=1;eVar1=we-think-youll-like.hero-2.nespresso-machine.link4 |
Red = Optional
In the above example there are 4 products each getting a ‘Merchandising List View’ event attribution of 1 to say that they have each been seen once from the ‘WE THINK YOU’LL LIKE’ merchandising module that was located in position ‘hero-2’ on the screen. The total count of the event is still only 1 but when broken down by products each product will also count 1 meaning that the sum of the items will be greater than the total. This is an intentional much like the way order counting works to make breakdown reports easier to use. However, if the desire is to have conversion rates nested correctly in a single report without needing to extract the data then the use of the optional numeric event may be required.
Merchandising Item Click
| s.events | event24 |
|---|---|
| s.products | category;sku;0;0;;eVar1=we-think-youll-like.hero-2.nespresso-machine.link.4 |
In the above example only a single product is sent to Adobe with a counter event captured to record the click occuring. In this case the eVar has been updated to include information about the specific item type that was clicked and what position it was in when it was clicked.
Passing Concatenated Meta Data
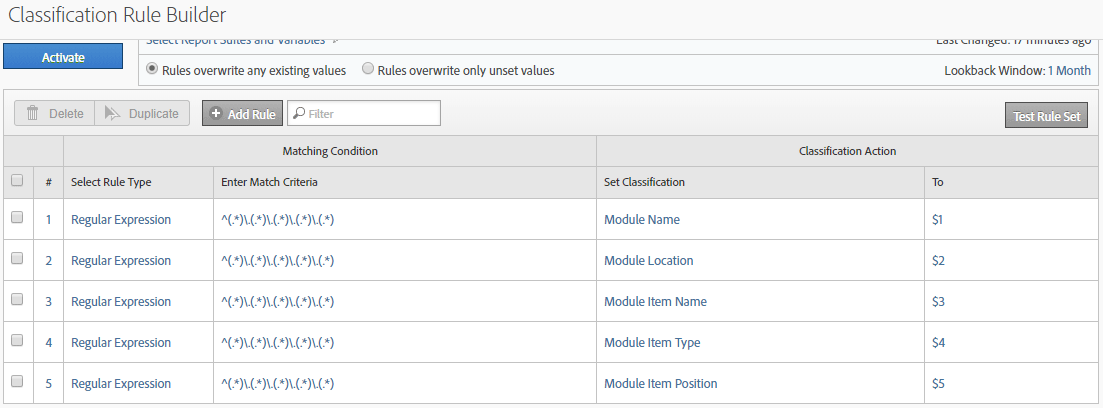
In addition to sending data into Adobe Analytics using this eVar logic we would also make use of the rules-based SAINT classification system to split the data from eVar into contributory parts. In the above examples this would be:
- Value 1 = Module Name
- Value 2 = Module Location
- Value 3 = Module Item Name
- Value 4 = Module Item Type
- Value 5 = Module Item Position
In the above example the 5 values that would get parsed would be:
Module Name = we-think-youll-like
Module Location = hero-2
Module Item Name = nespresso-machine
Module Item Type = link
Module Item Position = 4
The configuration with the Classification Rule Builder would therefore look like this:
Additional meta-data may be required from a reporting point of view such as Module Item Name or Module Item Destination. All of those additional parameters should be built into the original requirements and represented in the data layer to ensure Adobe can receive them. When working with DMPG to implement Merchandising tracking we will ensure all specific reporting requirements are catered for and if a change to the module logic is required to ensure scalability we can also facilitate this.
Data Analysis ‘How To’
We’ve covered the basics of what is possible to report on, how an overview of the data might look and how to send the data into Adobe Analytics to allow this. Now we’ll cover the steps of being able to achieve each individual reporting requirement:
- To understand when a merchandising module is seen by the customer
- Click on Module Name report
- Add the Merchandising List View event
The above report would provide the total count of merchandising modules that have come into view for the customer by module name.
- To understand what module items within a merchandising module is seen by the customer
- Click on Module Name report
- Add the Merchandising List View event
- Breakdown the Module Name report by the Module Item Name report
The above report would provide a count of merchandising modules that have come into view and then also show the each module item within these merchandising modules that were in view.
- To understand when a merchandising module item is clicked by the customer
- Click on Module Name report
- Add the Merchandising List View event
- Breakdown the Module Name report by the Module Item Name report
- Add the Merchandising Item Click event
This builds on the report from requirement #2 to provide the specific module item click data against each module item name.
- To understand what the conversion rate is for a module item that is clicked on
- Using the above report the conversion rate can be calculated from the total Merchandising List View event counts vs the Merchandising Item Click event counts
- NOTE – this conversion rate can only be provided by exporting the raw data. To provide conversion rate directly in the report the implementation would need to be updated to make use of the numeric Merchandising Item List View event.
- Using the above report the conversion rate can be calculated from the total Merchandising List View event counts vs the Merchandising Item Click event counts
- To understand what the conversion lift is for an asset when the module item is clicked
- Segment 1:
- Scope/Container = Visit
- Rule 1 = Order is equal or greater than 1
- Rule 2 = Merchandising Item Click equals 0
- Segment 2:
- Scope/Container = Visit
- Rule 1 = Order is equal or greater than 1
- Sub-Container/Scope = Hit
- Rule 1 = Product equals {sku}
- Rule 2 = Merchandising Item Click greater than or equal to 1
- Click on Product report
- Add Order Conversion Rate (Orders/Visits) in two columns
- Apply above segments to both columns of the report
The above report should allow you to compare the conversion rates for individual products based on whether they were clicked on from a merchandising module within the same visit. The analysis needs to be done on a per-product basis.
- Segment 1:
- To understand the conversion rate difference for a module item depending on what module it was in
- Using the above report change the Product report as follows:
- First dimension should be the Merchandising Module Name report
- Breakdown by Module Item Name report (or Product report if synonymous)
This report provides the same as #5 but allows you to analyse the data relative to the module from which the item was clicked.
- Using the above report change the Product report as follows:
- To understand the conversion rate difference for a module item depending on what location within the module it was in
- Click Module Name report
- Breakdown by Module Item Position Report
- Breakdown by Module Item Name report (or Product report if synonymous)
- Add Order Conversion Rate (Orders/Visits)This report provides a simple overview of conversion rates for the module items (products) based on which position they were seen in. The conversion rates here will only consider session level order conversion rates based on when a product was seen in any position but not necessarily clicked on. As such the conversion analysis might be better done with Segment 2 applied from requirement scenario #5.
- To understand the conversion rate difference for a module item depending on what type of screen it was located on
- Click on Screen Type report (assuming you have this in your implementation)
- Breakdown by Module Name report
- Breakdown by Module Item Name report (or Product report if synonymous)
- Add Order Conversion Rate (Orders/Visits)
Similar to #7 this will give a high-level overview of conversion from when a module item is seen. To understand more precise conversion it may be better to apply logic to only count conversion rates when the item is clicked. This report also assume you will have a Screen Type variable being used. This will come as standard for any implementation from DMPG and is designed to provide a higher-level overview of the function of a screen. This should allow for reporting based on screen functions rather than trying to look at individual screens (Screen Name) making the analysis much easier and probably more useful for making decisions.
- To understand the conversion rate difference for a module item depending on where on the screen it was located
- As per #8 but with an additional dimension after Screen Type of Module Location

DMPG University is coming soon
Recommended Training Courses
If you found this article interesting you may also be interested in the following courses:
- Adobe Analytics Fundamentals
- Advanced Analysis with Adobe Analytics Workspaces
- Adobe Target Standard Bootcamp
If you or members of your organisation would like us to create a custom course for you then we’re happy to do so. We charge per day rather than per head so can normally create something of significant value very easily.