
Online retail businesses live or die by their stock levels. A couple of challenging years characterised by supply-chain disruption and delayed order fulfilment have really underscored this in the industry. Monitoring stock availability has been a key priority for many of our clients this year, but how can we get this data into Adobe Analytics in the most effective way, to give us a clear view of what exactly is happening out there on our product detail pages (PDPs)?
Stock Availability in the Fashion/Retail world
The traditional literature on tracking stock status into Adobe Analytics has come from Greco in the past, and it’s a great explainer on how to get some simple but effective stock metrics set up such as “viewed availability”. The implementation is simple enough: set an event when the product is viewed “out of stock” and use it to work out the % of times it is viewed out of stock. However, an implementation along those lines is only really capable of handling a scenario where we have one product option on a page, which is becoming increasingly rare.
What happens when faced with a modern fashion retail PDP with a product that comes in 10 sizes and 3 different colours? Throw the ability to “pre-order” a product into the mix. Suddenly we have a fun dilemma – what counts as a product view being “out-of-stock” and how do we convey that information into Adobe Analytics?
Collecting Stock Status
The place to start is first ensuring that the stock information we need is available for collection. As stock status is constantly changing in real-time the only appropriate place to collect this information is client-side when the product is viewed. A surprising majority of new clients we work with do not have stock data surfaced into their client-side datalayers. There is a small amount of effort to get this set up but it’s more than worth it in the long run.
It’s likely you will need to work with site devs to call and consume whatever stock API powers the retailing functionality of the site and populate this into your data layer.
You will want to call this data at the highest data granularity offered on the product page and populate it for all product options offered on the PDP when the page is viewed. For each variant/option/sku/size (whatever terminology your business uses, I will use “variant” moving forward) you will want to populate:
- Stock Status: is the product in stock, out of stock OR is it on a pre-order status? Some businesses also like to include a “Low Stock” identifier which flags a product is under a certain amount of units.
- Stock Level: What is the actual number of units of stock left for this product.
You will need to find an appropriate data layer structure to house all this information which we won’t go into detail on here.
As a bonus additional to the data layer, you should also include some supplementary events which fire when a user selects a particular variant before adding to Cart – e.g. once we know they are interested in the “Red Dress in Size 10”, rather than just the “Dress.” Those can be used in testing initiatives to trigger “low stock” experiences.
Starting Simple – a Stock Status merchandising eVar
There is nothing wrong with setting a simple merchandising eVar when a user views the product page. It’s a quick way to enable a drill down to understand the % of products on our site which we consider to be “out of stock” and how this is affecting performance. In the example below we can quickly identify 10% of total product views are to unstocked products.
But we will need to make some decisions about how we configure the eVar… These choices in turn will be informed by how you use the product string. Typically most retail businesses operate a product string at a “variant” level, so it means we can have one value per variant.
It still throws up some challenges, for example:
- If a Dress is Out of Stock in all sizes in Green, but is in stock in all sizes in Blue > this is fine, we can flag the Green dress “Out Of Stock” and the Blue one “In Stock” when it is viewed.
- If a Red Dress is on pre-order in 1 size but In Stock for all others > should the Red Dress get “preOrder” status or “InStock” status?
- If a Dress is only in stock in 1 size (the least popular) across all colours > every colour variant will be flagged “In Stock”
None of these values are particularly “wrong.” But they aren’t that helpful. In the last example if we look at the data we are going to be blissfully unaware that it’s virtually impossible for customers to purchase our Dress. It is out of stock in nearly all sizes, despite our Analytics data giving us the thumbs up that everything is fine.
Example conceptual product string on prodView
eVar1 = Stock Status
eVar2 = Colour CodeProducts:
Product : SKU001
Quantity : 1
Price : 65.00
eVars : eVar1=InStock
Expected Data
| eVar1 Stock Status | Product Views | % Total Product Views |
|---|---|---|
| Total | 100 | |
| InStock | 50 | 50% |
| LowStock | 20 | 20% |
| preOrder | 20 | 20% |
| Out Of Stock | 10 | 10% |
Introducing Viewed Availability at Product/Variant level
To get around these issues we can go slightly further. We can take Greco’s original event based approach and adapt it for a multi-variant world.
What we need to do is fire counter events on our PDP. One of these events will represent the number of variants that a product is carried in and the other will be the number of those variants that are actually in stock. We can then divide the 2 to calculate “viewed availability.”
Again we have options here in that we can either do this at a top level “product” granularity or at a variant level.
Product: if a Dress is carried in 3 colours in 3 sizes, the total variants carried is 9. If one particular colour is totally out of stock then 6 variants are in stock. The viewed availability would be 6/9 = 66%
Variant: If we populate this at the variant level for the colour which is out of stock, we would get 0/3 = 0%
With this kind of metric set up on all products we can even get an overall number for all of our products on site which tells us “on average across all the individual items we sell x% are in stock at the time of viewing”
Example conceptual product string on prodView
eVar2 = Colour Code
eventA = Variants In Stock (All colours)
eventB = Variants Carried (All colours)
eventC = Variants In Stock (This colour only)
eventD = Variants Carried (This colour only)
Products:
Product : SKU001
Quantity : 1
Price : 65.00
Events : eventA=6|eventB=9|eventC=0|eventD=3
eVars : eVar2=GREEN
Expected Data
| Viewed Availability % (Variant Level) | Viewed Availability % (Product Level) | |
|---|---|---|
| Total | 0% | 66% |
| SKU001-GREEN | 0% | 66% |
Taking it Further: Weighted Viewed Availability
We still have an issue. Sizes and colours don’t get bought in equal proportion. It isn’t helpful if all of our products are “in stock”, but the sizes available are the least popular and unlikely to fit the needs of the customer.
To solve this our more advanced clients have taken their stock tracking implementation to the next level and introduced the concept of “weighted availability.”
Executing this means working with your trading team to get an average breakdown of the incidence that your sizes are sold at. In a simple set up in might look something like this:
| Size | XS | S | M | L | XL |
|---|---|---|---|---|---|
| % of total sales | 5% | 20% | 40% | 20% | 5% |
It’s now possible to modulate our viewed availability counter events.
If a product is only stocked in XS, instead of giving it 1/5 = 20% availability weighting, we would override this and give it a 5% weighting.
We have experimented trying to implement this logic with calculated metrics so we could keep the % up to date as they change. It is possible… but it’s extremely unwieldy. We prefer to run this logic at tag manager level.
This approach also gets complicated quickly. The main challenges come when:
- Clients offer sizing in multiple sizing scales e.g. S/M/L AND 8/10/12
- Clients offer products which do not come in all sizes and the % weighting must be calculated on the fly or simplifying compromises made.
- Again you have a choice of calculating this for all variants/colours or just for the one being viewed currently.
Of course, there are other routes to calculating these weightings for example in a BI tool, but housing them in the Adobe system means full integration with other solutions such as Product Recommendations is possible. The implementation is not for the faint hearted but gives an unparalleled view on what the actual state of stock is across your business and how this is actually likely to impact on conversion.
Example conceptual product string on prodView
eVar1 = Stock Status
eVar2 = Colour Code
eventA = Weighted Availability
Products:
Product : SKU001
Quantity : 1
Price : 65.00
Events : eventF=0.75
eVars : eVar1=InStock, eVar2=GREEN
| Weighted Viewed Availability % (Variant Level) eventF | |
|---|---|
| Total | 75% |
| SKU001-GREEN | 75% |
Number of Items left in Stock
Another direction we can take is one that revolves around our second datalayer point: “Stock Level.”
Knowing how much product is left is essential to Marketing & Trading teams. There is no point putting £s of spend behind a product which only has 10 units left in stock.
Again we can start with a simple merchandising eVar here, and pair it with a merchandising event. Populate into each the total number of units in stock for all sizes of the product being viewed.
The eVar allows for a quick list of products and their stock levels. The event allows us to work out the average number of items in stock when it is viewed by product. We can also use this at Category or Department level to see which areas of our business are well stocked and which are at risk of running out.
We also know in Analytics how many units the product sold yesterday/last week and we know how many units are stocked. Combining the 2 together we can work out how many days “cover” we have until this product runs out of stock. If a product is selling at an average of 100 items a day for the past week and we have 300 items left, we only have cover for 3 days.
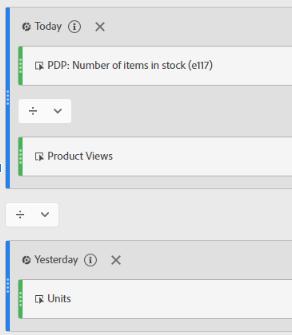
Calculated metrics allow us to indirectly include purple time dimensions in them if they are included within Segments that are then included in the metric. Something like the below achieves what we need:
Example conceptual product string on prodView
eVar2 = Colour Code
eVar3 = Items of Stock Available
eventG = Items of Stock Available
Products:
Product : SKU001
Quantity : 1
Price : 65.00
Events : eventG=300
eVars : eVar2=GREEN|eVar3=323
| AVG Items of Stock Remaining | Days of Stock Remaining at Current Selling Volumes | |
|---|---|---|
| SKU001-GREEN | 300 | 3 |
Next Steps
The above examples are just a start, there are likely to be several other useful abstractions and measures which can be built on top of stock data once it is available client side. We haven’t touched on how effective stock measures can be in a CRO testing roadmap or social proofing program… an article for another day.
To get started with building the measures above step one would be to review what stock availability information you have in your datalayer and work with devs to populate if you don’t have access currently. Thereafter the easiest place to start is to implement basic stock by variant eVars and viewed availability events in the product string. Weighted Availability and stock run rates would be the next thing to cover off but these are more advanced configurations and are not for the faint-hearted.